Tired of writing complex code for simple data tasks? Pandas makes Python data analysis surprisingly easy.
This powerful library transforms hours of manual work into just a few lines of code. Whether you’re filtering customer data, calculating sales trends, or building your first data science project, Pandas is your essential tool.
In this guide, you’ll discover:
Let’s turn screen time into skill time with Python’s most popular data analysis library.
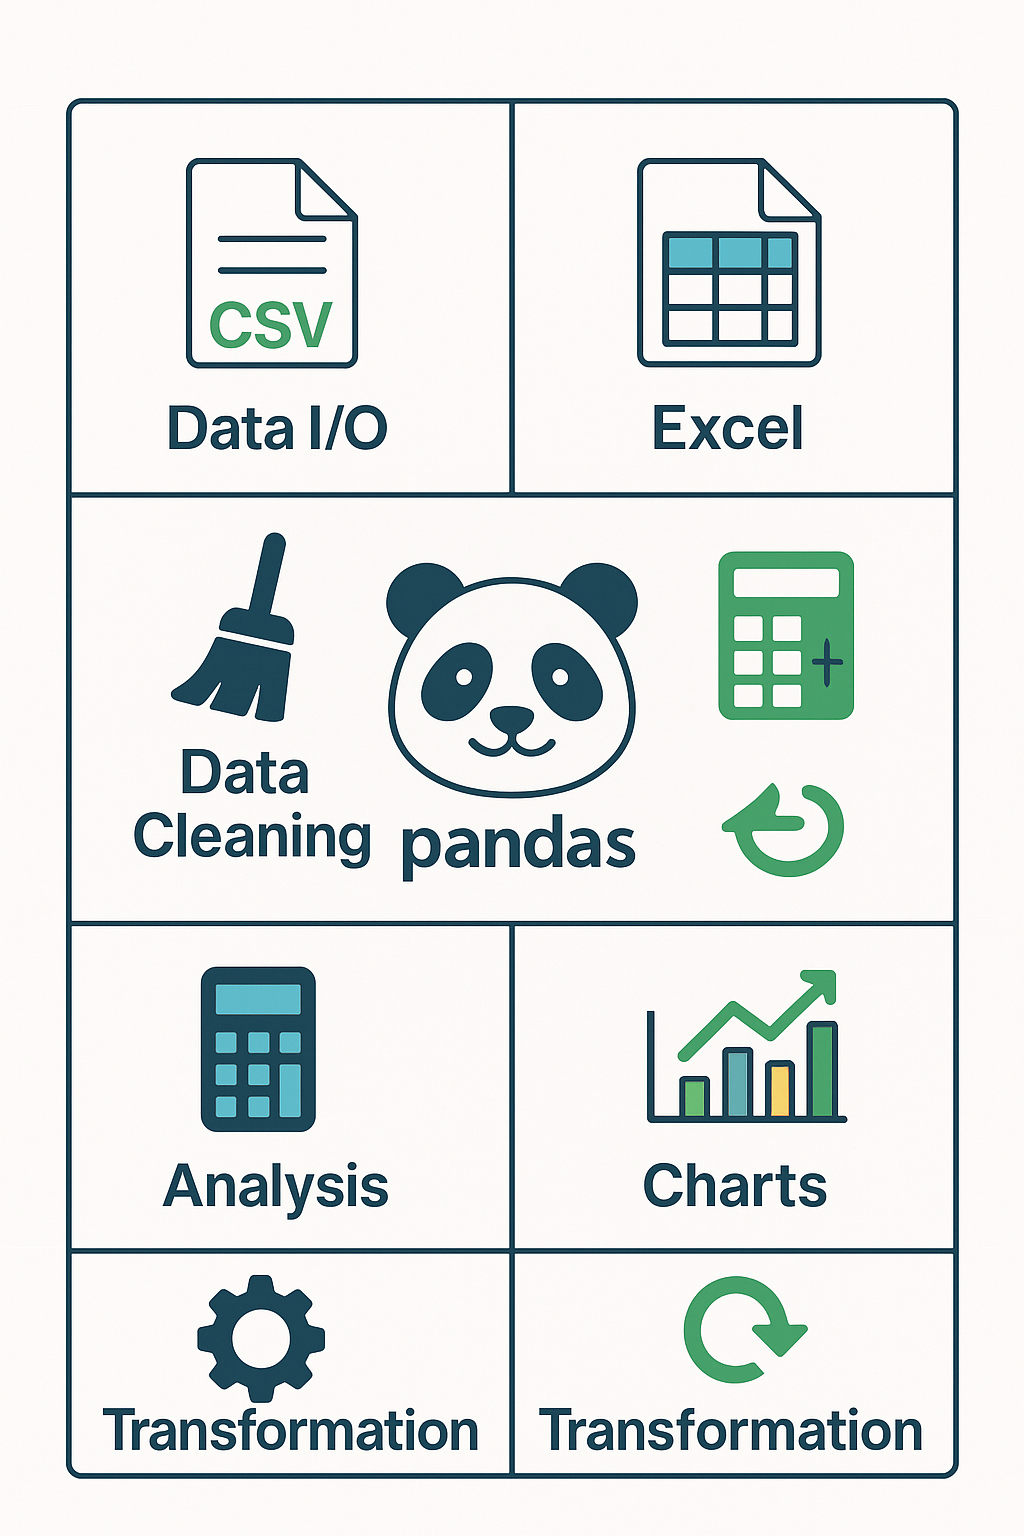
Pandas (Python Data Analysis Library) is an open-source library that makes working with data simple and powerful. Think of it as Excel’s smarter, faster cousin built for Python.
Pandas lets you:
The name “Pandas” comes from “Panel Data” and “Python Data Analysis Library.” It’s designed to make data manipulation feel natural and intuitive.
Created by Wes McKinney in 2008, Pandas started at AQR Capital Management. It became open-source in 2009.
Today, Pandas is downloaded over 60 million times per month as of January 2026. It’s the foundation for data science in Python, powering everything from school projects to Fortune 500 analytics.
Pandas works seamlessly with other Python tools:
Think of Pandas as your Swiss Army knife for data. It handles 80% of data tasks efficiently and elegantly.
For young learners exploring Python fundamentals, understanding what a variable in Python is helps build a strong foundation before diving into Pandas.
Before Pandas, simple tasks required extensive custom code. Calculating average sales by region? That meant writing 50+ lines of Python code.
With Pandas, it’s just one line:
df.groupby('region')['sales'].mean()
Performance Optimization
Pandas is built on highly optimized C libraries. It’s 10-100x faster than pure Python operations.
Your code runs quickly, even with millions of rows of data.
Intuitive Syntax
The library uses familiar concepts from SQL and Excel. Operations like filtering, grouping, and joining feel natural and readable.
Anyone comfortable with spreadsheets can learn Pandas quickly.
Comprehensive Functionality
From basic arithmetic to complex statistical operations, Pandas provides everything you need. You won’t need additional libraries for most tasks.
Data Type Flexibility
Unlike spreadsheet applications, Pandas handles multiple data types seamlessly. Integers, floats, strings, dates, and custom objects work together in the same dataset.
According to the 2025 Stack Overflow Developer Survey, Pandas is used by over 87% of data scientists and analysts worldwide.
Major companies rely on Pandas for critical data pipelines:
Learning Pandas accelerates your career growth. Many data scientists report that mastering Pandas was the gateway to advanced data science concepts.
Want to explore what else Python can do? Check out our guide on Python applications to see the bigger picture.
File Format Support:
Web Data Integration
Pandas reads data directly from APIs and web sources. This makes real-time data analysis projects simple and powerful.
Missing Data Handling:
Data Type Conversion:
Data Validation:
Statistical Operations:
Data Grouping and Aggregation:
Time Series Analysis:
For students interested in building data-driven projects, explore our Python science fair project ideas for inspiration.
Reshaping Operations:
Merging and Joining:
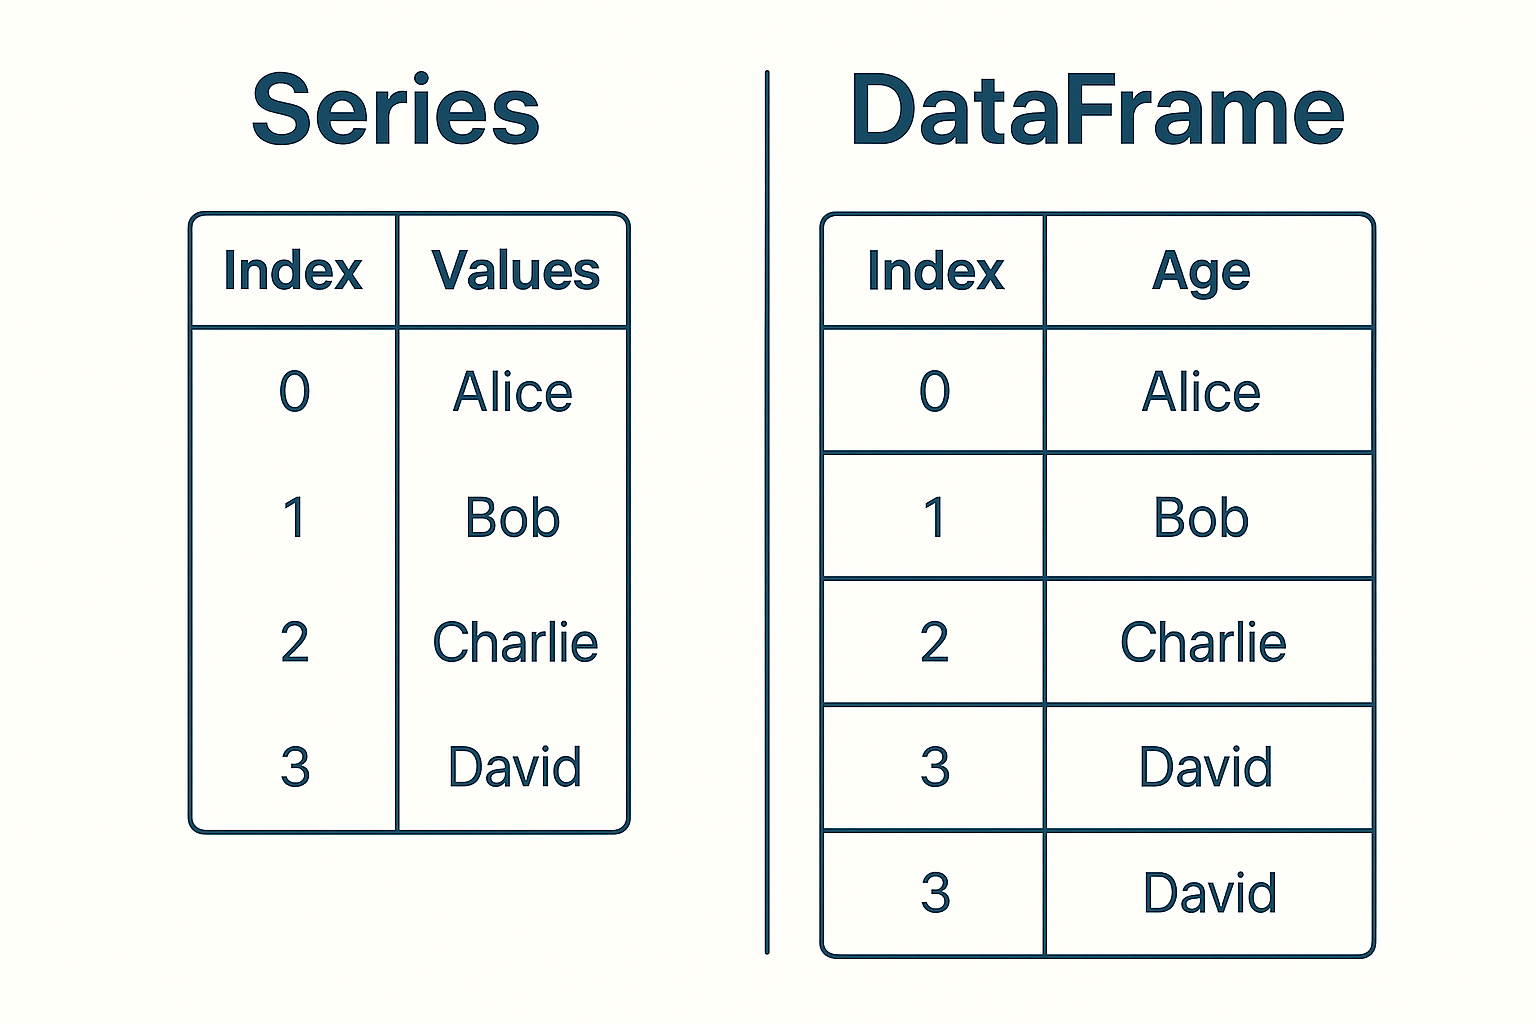
A Series is a labeled array that can hold any data type. Think of it as a single column in a spreadsheet with an index.
Series Characteristics:
Series Example:
import pandas as pd<br><br># Create a Series<br>sales_data = pd.Series([100, 150, 200, 175], <br> index=['Q1', 'Q2', 'Q3', 'Q4'],<br> name='Sales')<br>print(sales_data)<br># Output:<br># Q1 100<br># Q2 150<br># Q3 200<br># Q4 175<br># Name: Sales, dtype: int64<br>A DataFrame is like a spreadsheet or SQL table. It has rows and columns, with each column potentially containing different data types.
DataFrame Characteristics:
DataFrame Example:
# Create a DataFrame
sales_df = pd.DataFrame({
    'Product': ['Laptop', 'Phone', 'Tablet'],
    'Price': [999, 699, 399],
    'Quantity': [50, 100, 75],
    'Available': [True, True, False]
})
print(sales_df)
The index makes Pandas powerful. Unlike regular Python lists, Pandas structures have labeled indices that enable:
Advanced Indexing:
Understanding indexing is crucial for efficient Pandas usage. Proper index design makes operations 10x faster and code much more readable.
Using pip (Recommended for beginners):
pip install pandas
Using conda (Recommended for data science):
conda install pandas
Installing with additional dependencies:
# For Excel file support
pip install pandas openpyxl xlrd

# For complete data science stack
pip install pandas numpy matplotlib seaborn jupyter
import pandas as pd
print(pd.__version__)
# Should display version 2.2.0 or higher (as of January 2026)

# Check available functionality
print(pd.show_versions())
Jupyter Notebook (Recommended for learning):
pip install jupyter
jupyter notebook
VS Code with Python Extension:
Google Colab (No installation required)
Pandas comes pre-installed in Google Colab. Perfect for beginners who want to start immediately without setup.
Virtual Environment Management:
# Create virtual environment
python -m venv pandas_env

# Activate (Windows)
pandas_envScriptsactivate

# Activate (macOS/Linux)
source pandas_env/bin/activate

# Install packages
pip install pandas jupyter matplotlib
Configuration Tips:
From CSV Files:
# Basic CSV reading
df = pd.read_csv('data.csv')

# Advanced options
df = pd.read_csv('data.csv',
                 index_col='Date',        # Set Date as index
                 parse_dates=True,        # Parse dates automatically
                 na_values=['N/A', ''])   # Define missing values
From Excel Files:
# Read Excel file
df = pd.read_excel('data.xlsx', sheet_name='Sales')

# Read multiple sheets
all_sheets = pd.read_excel('data.xlsx', sheet_name=None)
From Databases:
import sqlite3

# Connect to database
conn = sqlite3.connect('database.db')
df = pd.read_sql_query('SELECT * FROM sales', conn)
Basic Information:
# Dataset shape
print(df.shape)  # (rows, columns)

# Data types and info
print(df.info())

# Statistical summary
print(df.describe())

# First/last few rows
print(df.head())
print(df.tail())
Column and Index Operations:
# Column names
print(df.columns.tolist())

# Select specific columns
subset = df[['Name', 'Age', 'Salary']]

# Select by condition
high_earners = df[df['Salary'] > 50000]
Handling Missing Values:
# Check for missing values
print(df.isnull().sum())

# Fill missing values
df['Age'].fillna(df['Age'].mean(), inplace=True)

# Drop rows with missing values
df_clean = df.dropna()
Data Type Conversion:
# Convert data types
df['Date'] = pd.to_datetime(df['Date'])
df['Category'] = df['Category'].astype('category')
df['Price'] = pd.to_numeric(df['Price'], errors='coerce')
Removing Duplicates:
# Check for duplicates
print(df.duplicated().sum())

# Remove duplicates
df_unique = df.drop_duplicates()
Filtering Data:
# Single condition
young_employees = df[df['Age'] < 30]

# Multiple conditions
experienced_seniors = df[(df['Age'] > 50) & (df['Experience'] > 10)]

# Using isin() for multiple values
tech_roles = df[df['Department'].isin(['IT', 'Engineering', 'Data Science'])]
Grouping and Aggregation:
# Group by single column
dept_stats = df.groupby('Department')['Salary'].agg(['mean', 'median', 'count'])

# Group by multiple columns
region_dept_sales = df.groupby(['Region', 'Department'])['Sales'].sum()

# Custom aggregation
custom_agg = df.groupby('Department').agg({
    'Salary': ['mean', 'max'],
    'Age': 'mean',
    'Experience': 'median'
})
Sorting Data:
# Sort by single column
df_sorted = df.sort_values('Salary', ascending=False)

# Sort by multiple columns
df_multi_sort = df.sort_values(['Department', 'Salary'],
                               ascending=[True, False])
To CSV:
df.to_csv('output.csv', index=False)
To Excel:
# Single sheet
df.to_excel('output.xlsx', sheet_name='Data', index=False)

# Multiple sheets
with pd.ExcelWriter('multi_sheet.xlsx') as writer:
    df1.to_excel(writer, sheet_name='Sheet1')
    df2.to_excel(writer, sheet_name='Sheet2')
For students ready to practice these skills, try our collection of Python coding challenges for beginners to build confidence.
Sales Performance Analysis:
# Monthly sales trends
monthly_sales = df.groupby(df['Date'].dt.month)['Sales'].sum()

# Top performing products
top_products = df.groupby('Product')['Revenue'].sum().nlargest(10)

# Customer segmentation
customer_segments = df.groupby('Customer_Type')['Purchase_Amount'].agg(['mean', 'count'])
Financial Analysis
Pandas excels in financial data analysis. Investment firms use it for:
Data Processing
Research institutions use Pandas to:
Example – Clinical Trial Analysis:
# Analyze patient outcomes
outcome_analysis = df.groupby(['Treatment_Group', 'Gender']).agg({
    'Recovery_Time': 'mean',
    'Side_Effects': 'count',
    'Success_Rate': 'mean'
})
User Behavior Analysis:
# Page view analysis
page_views = df.groupby('Page_URL')['Views'].sum().sort_values(ascending=False)

# User session analysis
session_data = df.groupby('User_ID').agg({
    'Session_Duration': 'mean',
    'Page_Views': 'sum',
    'Conversion': 'max'
})
For students learning programming, Pandas provides an excellent introduction to data structures and algorithms.
Many coding education platforms use data analysis examples to teach logical thinking. Young learners can explore these concepts through hands-on projects.
Campaign Performance:
# A/B test analysis
campaign_results = df.groupby('Campaign_Type').agg({
    'Click_Rate': 'mean',
    'Conversion_Rate': 'mean',
    'Cost_Per_Click': 'mean',
    'ROI': 'mean'
})

# Customer lifetime value
clv_analysis = df.groupby('Customer_Segment')['Total_Revenue'].sum()
Students interested in applying these skills can explore machine learning concepts to understand how data analysis connects to AI.
| Feature | Pandas | NumPy |
|---|---|---|
| Data Structure | DataFrame, Series (labeled) | ndarray (unlabeled) |
| Data Types | Mixed types per column | Homogeneous types |
| Missing Data | Native support | Limited support |
| File I/O | Extensive (CSV, Excel, SQL) | Basic (binary formats) |
| Use Case | Data analysis, manipulation | Numerical computing |
When to use NumPy: Mathematical operations, linear algebra, array computations
When to use Pandas: Data cleaning, analysis, file operations, business intelligence
Want to dive deeper into NumPy? Read our comprehensive guide on what is NumPy and how it powers Pandas.
| Aspect | Pandas | Excel |
|---|---|---|
| Data Size | Millions of rows | ~1 million row limit |
| Automation | Full scripting capability | Limited macro functionality |
| Version Control | Git-friendly code | Binary file format |
| Reproducibility | 100% reproducible | Manual steps difficult |
| Cost | Free and open-source | Requires license |
Similarities:
Differences:
Integration Approach: Many data analysts use SQL for data extraction and Pandas for analysis and visualization—leveraging the strengths of both tools.
For statistical analysis, R has traditionally been preferred. However, Pandas combined with libraries like SciPy and Statsmodels provides comparable functionality.
The advantage? Python’s broader ecosystem makes it more versatile for general-purpose programming and deployment.
The choice between tools depends on your specific use case and existing technology stack. Pandas excels when you need Python integration and general-purpose data manipulation.
Import Conventions:
import pandas as pd
import numpy as np
import matplotlib.pyplot as plt

# Always use standard aliases
# This makes your code readable to other analysts
Function Organization:
def load_and_clean_data(filename):
    """Load data and perform basic cleaning."""
    df = pd.read_csv(filename)
    df = df.dropna()
    df['Date'] = pd.to_datetime(df['Date'])
    return df

def analyze_sales_by_region(df):
    """Analyze sales performance by region."""
    return df.groupby('Region')['Sales'].agg(['sum', 'mean', 'count'])
Memory Management:
# Check memory usage
print(df.info(memory_usage='deep'))

# Optimize data types
df['Category'] = df['Category'].astype('category')
df['Small_Integer'] = df['Small_Integer'].astype('int8')

# Use chunking for large files
chunk_list = []
for chunk in pd.read_csv('large_file.csv', chunksize=10000):
    # Process chunk
    processed_chunk = chunk.groupby('Category').sum()
    chunk_list.append(processed_chunk)

final_result = pd.concat(chunk_list, ignore_index=True)
Efficient Operations:
# Use vectorized operations instead of loops
# ❌ Bad
for i in range(len(df)):
    df.loc[i, 'New_Column'] = df.loc[i, 'Column1'] * df.loc[i, 'Column2']

# ✅ Good
df['New_Column'] = df['Column1'] * df['Column2']

# Use query() for complex filtering
result = df.query('Age > 25 and Salary > 50000 and Department == "Engineering"')
Robust Data Loading:
def safe_read_csv(filename, **kwargs):
    """Safely read CSV with error handling."""
    try:
        df = pd.read_csv(filename, **kwargs)
        print(f"Successfully loaded {len(df)} rows")
        return df
    except FileNotFoundError:
        print(f"File {filename} not found")
        return pd.DataFrame()
    except pd.errors.EmptyDataError:
        print(f"File {filename} is empty")
        return pd.DataFrame()
    except Exception as e:
        print(f"Error loading file: {e}")
        return pd.DataFrame()
Data Validation:
def validate_data(df, required_columns, numeric_columns):
    """Validate DataFrame structure and content."""
    # Check required columns
    missing_cols = set(required_columns) - set(df.columns)
    if missing_cols:
        raise ValueError(f"Missing required columns: {missing_cols}")

    # Check numeric columns
    for col in numeric_columns:
        if not pd.api.types.is_numeric_dtype(df[col]):
            print(f"Warning: {col} is not numeric")

    return True
Self-Documenting Code:
# Clear variable names
customer_purchase_history = df.groupby('customer_id')['purchase_amount'].sum()

# Meaningful function names
def calculate_monthly_recurring_revenue(subscription_data):
    """Calculate MRR from subscription data."""
    return subscription_data.groupby('month')['subscription_fee'].sum()

# Document complex operations
# Create customer segments based on purchase behavior
# High value: >$1000, Medium: $500-$1000, Low: <$500
df['customer_segment'] = pd.cut(df['total_purchases'],
                               bins=[0, 500, 1000, float('inf')],
                               labels=['Low', 'Medium', 'High'])
❌ Assuming Data Types
# Problem: Pandas might infer wrong data types
df = pd.read_csv('data.csv')

# ✅ Solution: Specify data types explicitly
df = pd.read_csv('data.csv', dtype={
    'customer_id': 'str',
    'amount': 'float64',
    'date': 'str'  # Convert to datetime separately
})
df['date'] = pd.to_datetime(df['date'])
❌ Ignoring Index Issues
# Problem: Losing index during operations
result = df.groupby('category').sum()  # Creates new index
final = result.reset_index()  # Often forgotten

# ✅ Solution: Be explicit about index handling
result = df.groupby('category').sum().reset_index()
❌ Using Loops Instead of Vectorization
# Slow: Loop-based calculation
total = 0
for index, row in df.iterrows():
    total += row['price'] * row['quantity']

# Fast: Vectorized calculation
total = (df['price'] * df['quantity']).sum()
❌ Inefficient Filtering
# Inefficient: Multiple steps
df_filtered = df[df['age'] > 25]
df_filtered = df_filtered[df_filtered['salary'] > 50000]
df_filtered = df_filtered[df_filtered['department'] == 'Engineering']

# ✅ Efficient: Single step
df_filtered = df[(df['age'] > 25) &
                 (df['salary'] > 50000) &
                 (df['department'] == 'Engineering')]
❌ Not Handling Missing Values
# Problem: Ignoring missing data
result = df.groupby('category')['value'].mean()  # Might give unexpected results

# ✅ Solution: Explicit missing data handling
df_clean = df.dropna(subset=['category', 'value'])
result = df_clean.groupby('category')['value'].mean()
❌ Memory Management Oversights
# Problem: Loading entire large dataset
df = pd.read_csv('huge_file.csv')  # Might crash

# ✅ Solution: Use chunking or sampling
# For exploration
df_sample = pd.read_csv('huge_file.csv', nrows=10000)

# For processing
for chunk in pd.read_csv('huge_file.csv', chunksize=10000):
    process_chunk(chunk)
❌ Correlation vs Causation
Be careful not to assume causation from correlation. Always validate statistical findings with domain knowledge.
❌ Ignoring Data Distribution
# Always check data distribution before analysis
print(df['salary'].describe())
print(df['salary'].hist())  # Visual inspection

# Use appropriate measures for skewed data
median_salary = df['salary'].median()  # Better than mean for skewed data
For students ready to avoid these pitfalls and advance their skills, our guide on how to clean and prepare data with Pandas provides practical solutions.
Essential Resources:
Structured Courses:
Interactive Learning:
Beginner-Friendly Datasets:
Where to Find Data:
Project Ideas:
Portfolio Tips:
After mastering basics:
Understanding Pandas opens doors to various careers:
Students interested in exploring who created Python can read about who developed Python to understand the language’s origins.
u003cstrongu003eNo.u003c/strongu003e Most beginners perform useful data analysis within a few days of starting. Practice with real datasets and build complexity gradually.u003cbru003e
u003cstrongu003eNo.u003c/strongu003e Basic Python knowledge (variables, functions, loops) is enough to start. Check our u003ca href=u0022https://itsmybot.com/what-is-a-variable-in-python/u0022u003ePython basics guideu003c/au003e for foundation concepts.u003cbru003e
u003cstrongu003eYes.u003c/strongu003e Pandas handles millions of rows efficiently. For larger datasets, use chunking techniques or Dask.u003cbru003e
u003cstrongu003eYes.u003c/strongu003e Pandas is open-source and free for both personal and commercial use without restrictions.u003cbru003e
u003cstrongu003ePandas is more powerfulu003c/strongu003e for large datasets and automation. Excel works better for quick visualization. Many analysts use both together.u003cbru003e
u003cstrongu003eStart with real datasets that interest you.u003c/strongu003e Work on Kaggle competitions and build portfolio projects.u003cbru003e
u003cstrongu003eYes.u003c/strongu003e Combine Pandas with Flask or Django for data processing, APIs, and dashboards in web applications.u003cbru003e
u003cstrongu003eMajor versions release annuallyu003c/strongu003e, with minor updates every few months to stay current with data science needs.
Pandas is an essential Python library that transforms complex data analysis into simple, readable operations. It’s the foundation for data science in Python and a must-learn tool for anyone working with data in 2026.
Pandas simplifies data analysis
What takes hundreds of lines in pure Python requires just a few lines with Pandas. It’s designed for productivity and clarity.
Two main data structures
Series (1D) and DataFrame (2D) handle most data analysis needs. Master these and you’re well on your way.
Built for performance
Optimized C libraries make Pandas 10-100x faster than pure Python. Your code runs quickly, even with large datasets.
Industry standard
Used by 87% of data professionals worldwide. Learning Pandas opens career opportunities across industries.
Comprehensive functionality
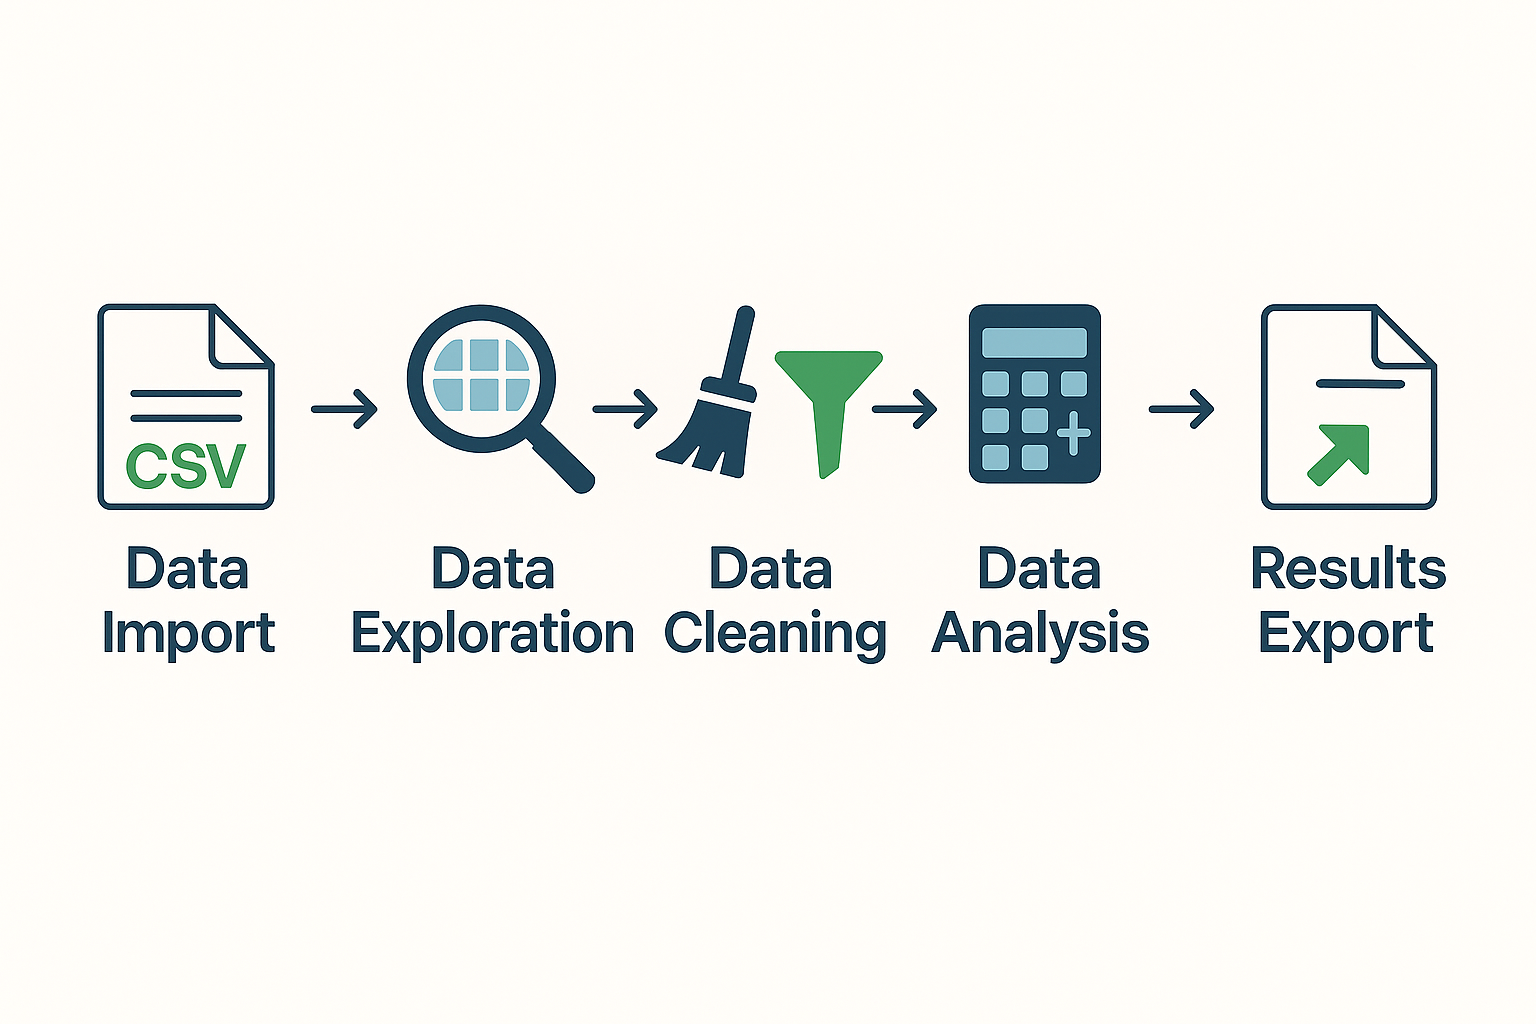
Handles data import, cleaning, analysis, and export in one library. You won’t need to learn multiple tools for basic tasks.
Week 1-2: Foundation
Week 3-4: Build Skills
Month 2: Advanced Features
Month 3: Integration
Month 4+: Real Projects
Learning Pandas is often a career-changing skill. Based on industry data, professionals who master Pandas typically experience:
Faster project completion
50-70% reduction in analysis time compared to manual methods or pure Python.
Better job opportunities
Pandas skills are required for most data roles. It’s a foundational skill for data analysts, scientists, and engineers.
Increased earning potential
Data analysts with Pandas skills earn 20-30% more on average than those without.
Enhanced problem-solving
Ability to tackle complex business questions with data. You become a more valuable team member.
The data analysis landscape continues to evolve, but Pandas remains the foundational tool every data professional should master.
Whether you’re:
Pandas provides the tools you need to succeed.
Remember: The journey from beginner to expert is built on consistent practice and real-world application.
Start with simple projects. Gradually increase complexity. Don’t hesitate to leverage the extensive community resources available.
The time you invest in learning Pandas will pay dividends throughout your data career.
As the field of data science continues to grow—with applications ranging from artificial intelligence to educational technology—Pandas skills become increasingly valuable.
The foundation you build today with Pandas will serve you well as you explore advanced topics like machine learning, big data processing, and statistical modeling.
Ready to turn screen time into skill time? Start your Pandas journey today with ItsMyBot’s personalized Python courses designed for young learners. Build confidence, master real-world skills, and unlock your future in technology.
Data analysis has become the backbone of modern decision-making across industries. From analyzing customer behavior in e-commerce to processing financial transactions, the ability to efficiently manipulate and analyze data determines success in today’s data-driven world.
In my 15 years of working with data analysis tools, I’ve witnessed the evolution from manual Excel manipulations to sophisticated Python libraries. Pandas stands out as the most transformative tool I’ve encountered—it’s literally changed how millions of analysts and data scientists approach their work.
💡 Key Takeaway: Pandas isn’t just another Python library; it’s the foundation that makes Python the world’s most popular language for data analysis and data science.
Want your child to go further? Explore ItsMyBot’s Data Science Classes for Kids — structured coding courses designed for kids!
